How to use DecisionMind
From the sentence you type on the home page to the report you cite: every screen of the analysis, in the order you meet it, with what to look at and what to press.
Home and the consultant
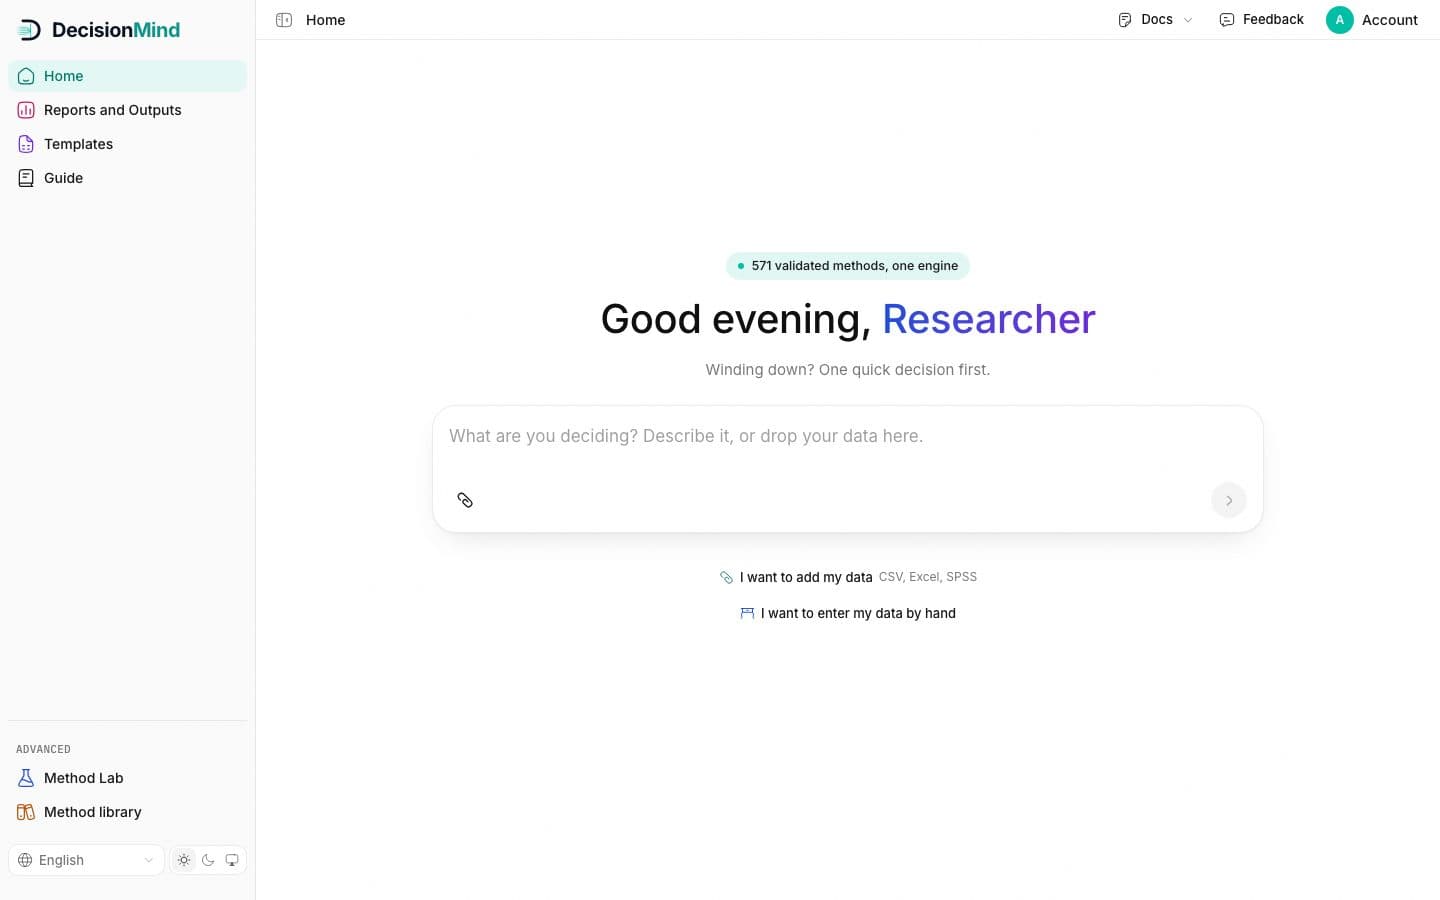
The home page is one question and one box. Write what you are deciding in your own words, or add your data straight away; the consultant takes it from there.
The analysis in six steps
The stepper at the top of the wizard names them; the sections below walk each one.
- 1Chat
Describe the decision on the home page, or drop your data in.
- 2Data check
Confirm how the system read your file: roles, directions, distributions.
- 3Goal
Complete one sentence: what you want, where the result goes, how deep the validation runs.
- 4Method
The system's pick and two alternatives, with reasons; the choice stays yours.
- 5Criterion weights
Equal, derived from the data, typed in, or from pairwise comparison.
- 6Run and collect
Review the four parts, run, read the result card, download the report.
Describe the decision
Type a sentence like "choose a supplier for our new line" and press the arrow. The consultant answers in the same box, asks what it needs, and opens the right step when your data is in. Nothing you write is a command to the system; the system only runs when you press Run in the last step.
The two lines under the box
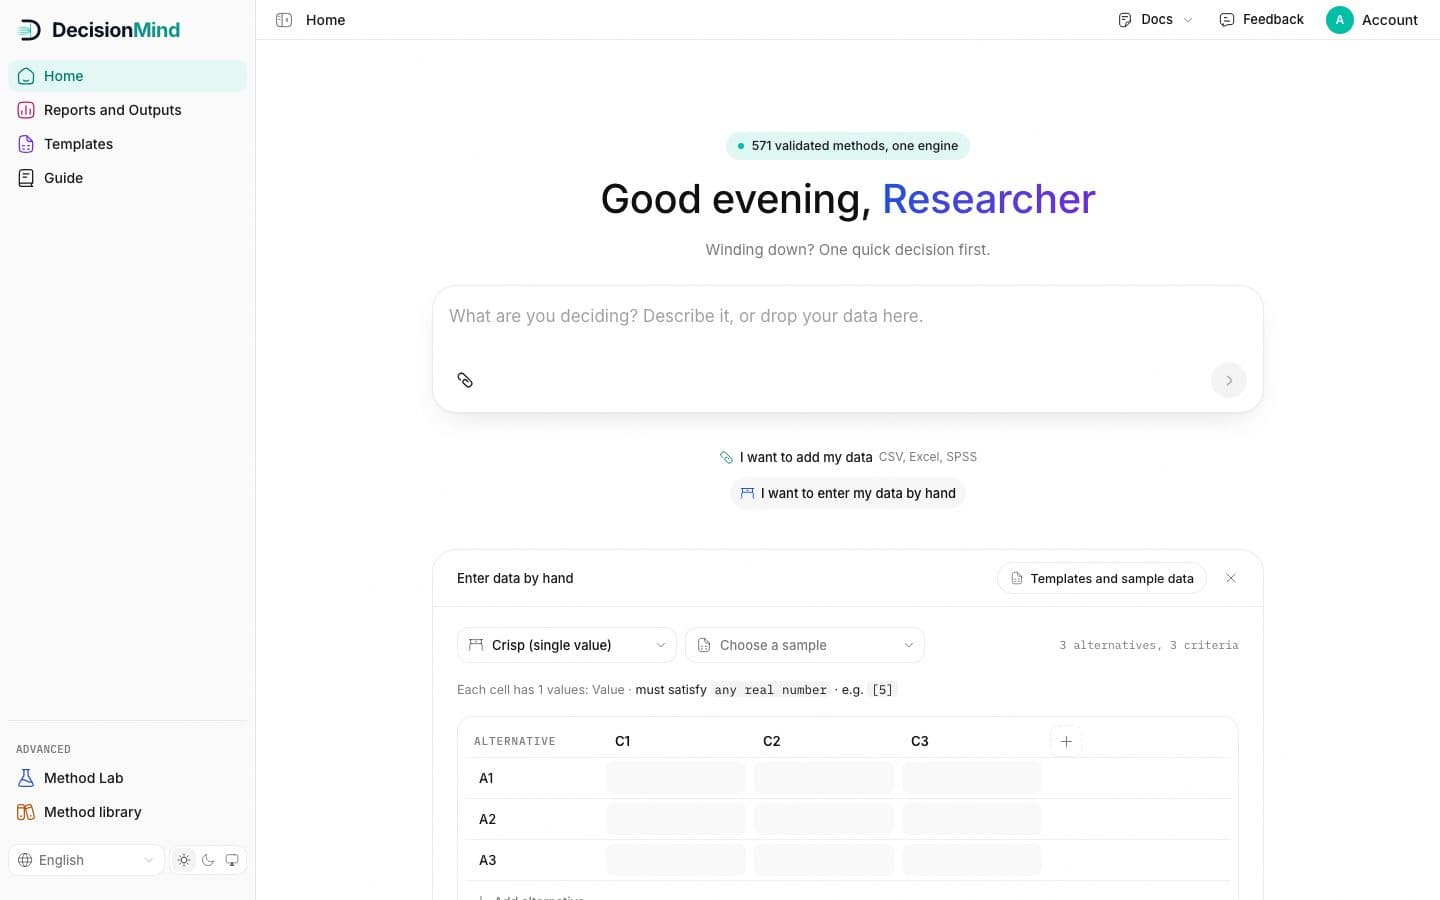
I want to add my data opens the file picker (CSV, Excel, SPSS). I want to enter my data by hand opens the table editor under the box, with a link to templates and sample data. Both lead to the same data check.
The consultant in the wizard
From the data check onward the consultant sits in a rail on the right. It answers questions about the step you are on and only names methods the system found for your data; it never invents a number. Suggested questions sit above the input, and you can hide the rail with the edge tab when you need the width.
Finding your way
- Home: the chat box.
- Reports and Outputs: every analysis you ran or left as a draft.
- Templates: blank files per data type and sample data sets.
- Guide: this text.
- History: your latest work, with a search box.
- Advanced: Method Lab and the method library.
Adding your data
Your data is one table: alternatives in rows, criteria in columns. There are four ways to bring it in, and every one of them lands on the same data check.
Four ways in
Add a file
The paperclip in the box, or drag the file onto it. CSV, Excel or SPSS.
Enter by hand
Pick a data type, set the number of alternatives and criteria, fill the cells. Good for small tables and for trying a cell format.
Start from a template
Download a blank Excel or CSV in the cell syntax of your data type, fill it, add it back.
Open a sample
Sample data sets open a ready draft, so you can walk the whole wizard before touching your own file.
Accepted files
- CSV: comma, semicolon, tab or pipe separated; the separator is detected.
- Excel (.xlsx).
- SPSS (.sav).
- The size limit is shown next to the paperclip; character encodings are handled for you.
How the table must look
- The first row names the criteria.
- The first column names the alternatives; if there is no such column, the parser takes the first column as the names.
- Each cell is the value of that alternative on that criterion, in the cell format of your data type.
| Alternative | Cost (USD) | Quality | Delivery |
|---|---|---|---|
| Supplier A | 120 | 8 | 7 |
| Supplier B | 95 | 6 | 9 |
Example: two alternatives on three criteria. "Cost (USD)" is read as a cost criterion, lower is better; you can change that on the next screen.
Data check
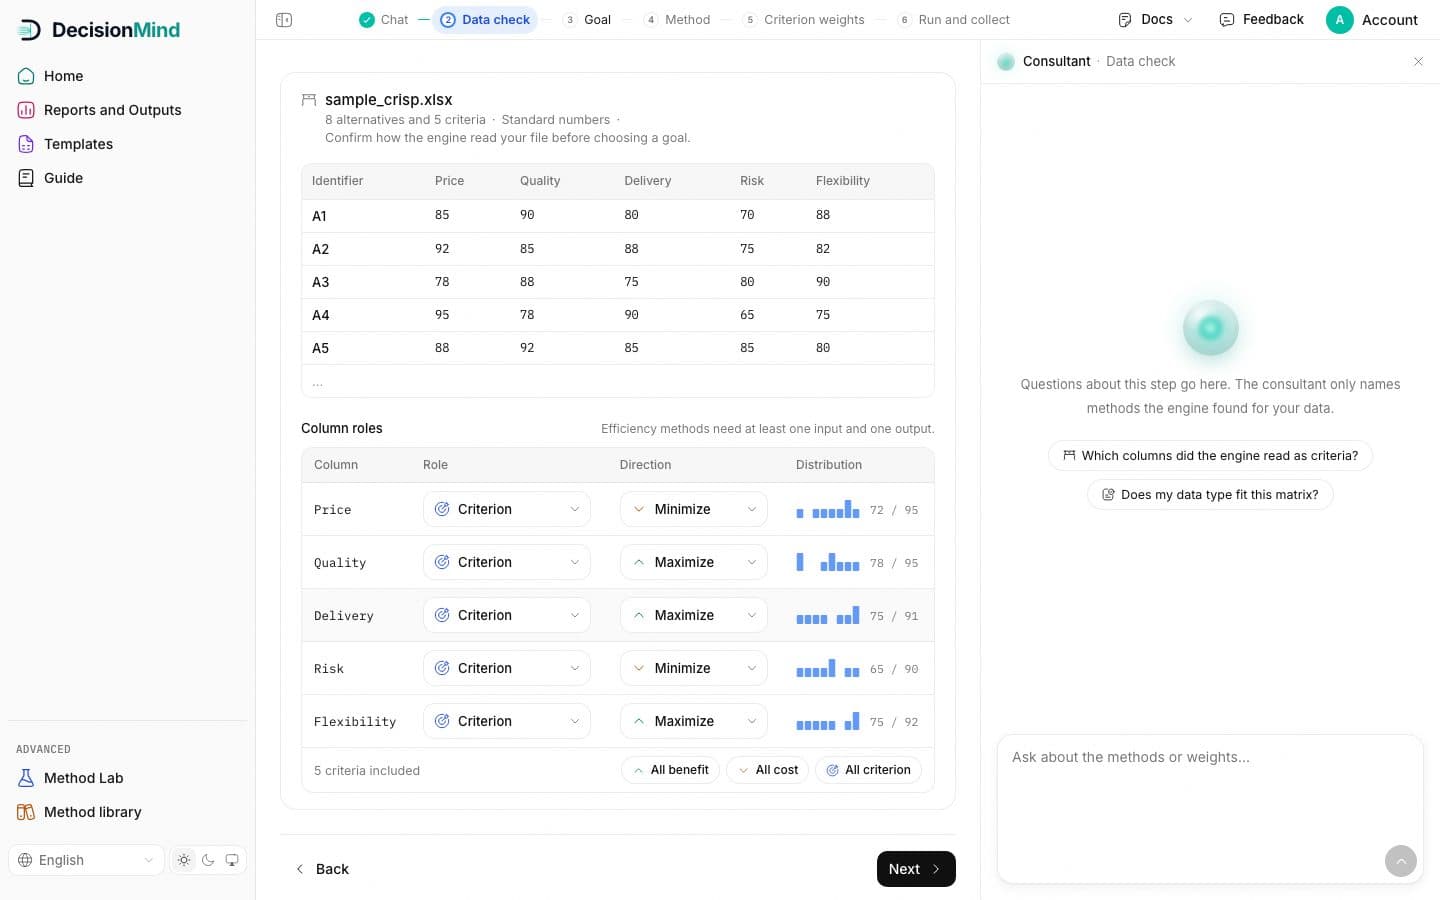
The first wizard step shows how the system read your file. Confirm the column roles and the directions here; everything after this step trusts them.
The preview
The card names the file, counts alternatives and criteria and states the data type it detected. The table under it is your data as parsed, the first rows with a link to the rest.
Column roles
Every column gets a role: a criterion, or the identifier that names the alternatives. Efficiency goals need at least one input and one output column, and the roles menu offers those when the goal calls for them. A column you do not want in the analysis is left out from its role menu.
Direction: maximize or minimize
- A header that reads like cost, price, risk or time is proposed as minimize; the rest as maximize.
- Change any column from its own menu, or set all columns at once with All benefit and All cost.
- A wrong direction flips the ranking, so read this row before you move on.
The distribution strip
The small bars at the end of each row draw the spread of that column with its lowest and highest value. A column whose bars are all the same height will not separate the alternatives; the system tells you so in the warnings.
Data types and cell formats
Besides plain numbers, the system reads uncertain and fuzzy cells. The type is detected from the cells; the formats are:
| Type | A cell looks like |
|---|---|
| Crisp | 7.5 |
| Interval / Grey Number | [4, 7] |
| Fuzzy (TFN) | (3, 5, 7) |
| Intuitionistic Fuzzy (IFS) | (0.6, 0.3) |
| Pythagorean Fuzzy (PFS) | (0.7, 0.4) |
| Fermatean Fuzzy (FFS) | (0.8, 0.5) |
| Single-Valued Neutrosophic (SVN) | (0.6, 0.2, 0.3) |
| Hesitant (HFS) | {0.4, 0.6, 0.7} |
Goal
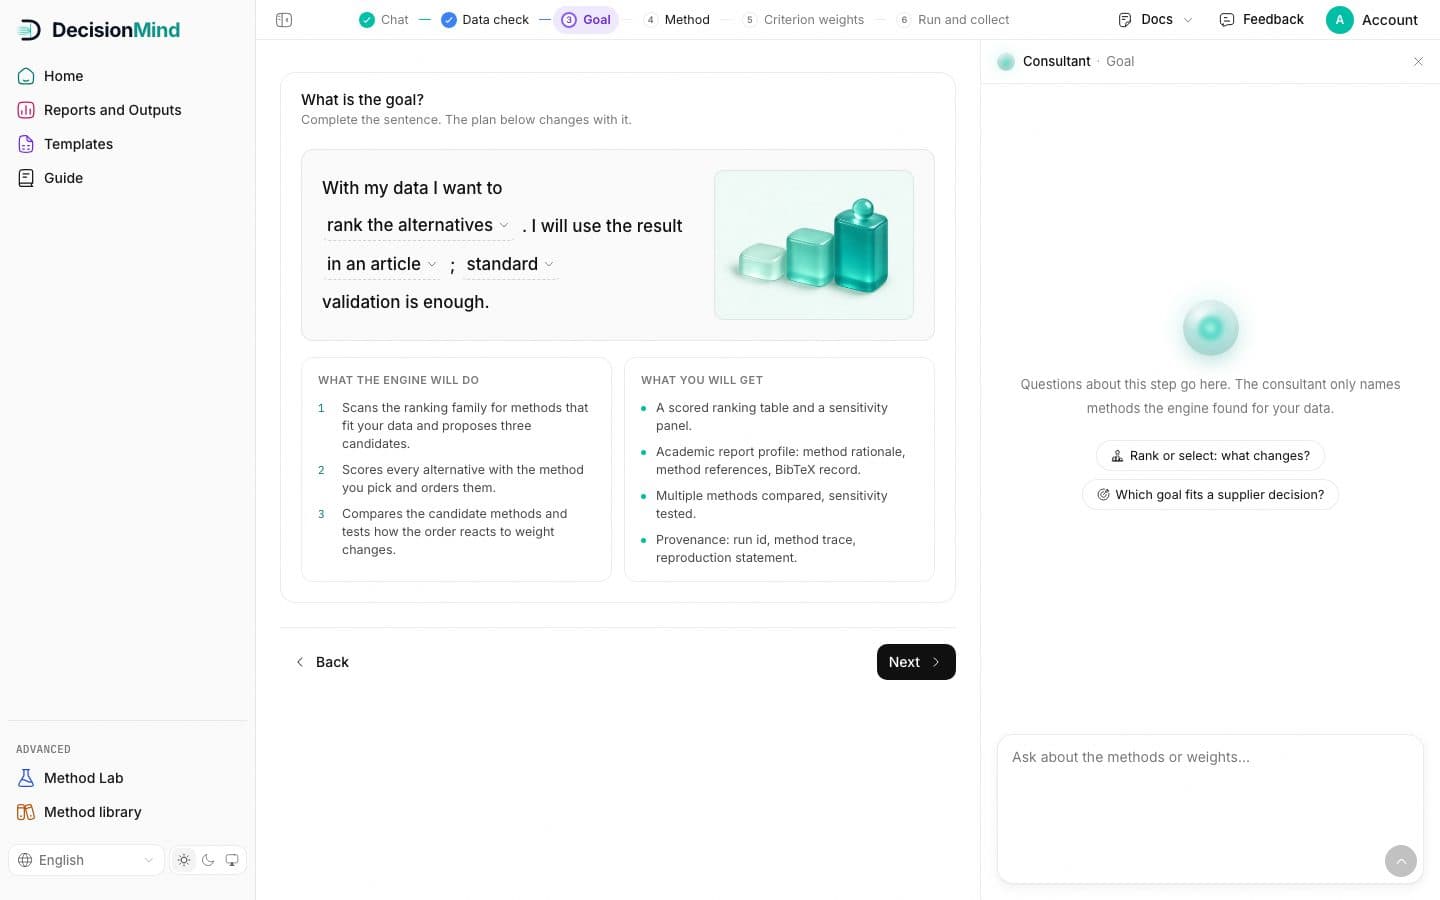
The goal is one sentence with three blanks. The system reads it to decide which methods to look at and which report layout to prepare.
The three blanks
- What you want: rank the alternatives, find the criteria weights, or measure the units' efficiency.
- Where the result goes: an article, a thesis, a report, a decision at work. This picks the report layout.
- How deep the validation runs: basic, standard or deep.
The two plan boxes
Under the sentence, What the system will do lists the work in order, and What you get lists the outputs. They change as you change the sentence, so you know before you continue what the run will produce.
Changing your mind later
The sentence stays on top of the next steps as a plan line. Change the goal opens this step again; the steps after it are redone because the method candidates depend on the goal.
Method
The system scans the methods that fit your data type and goal and shows three candidates. Its pick is selected; you can select another, read the details, or add methods to compare.
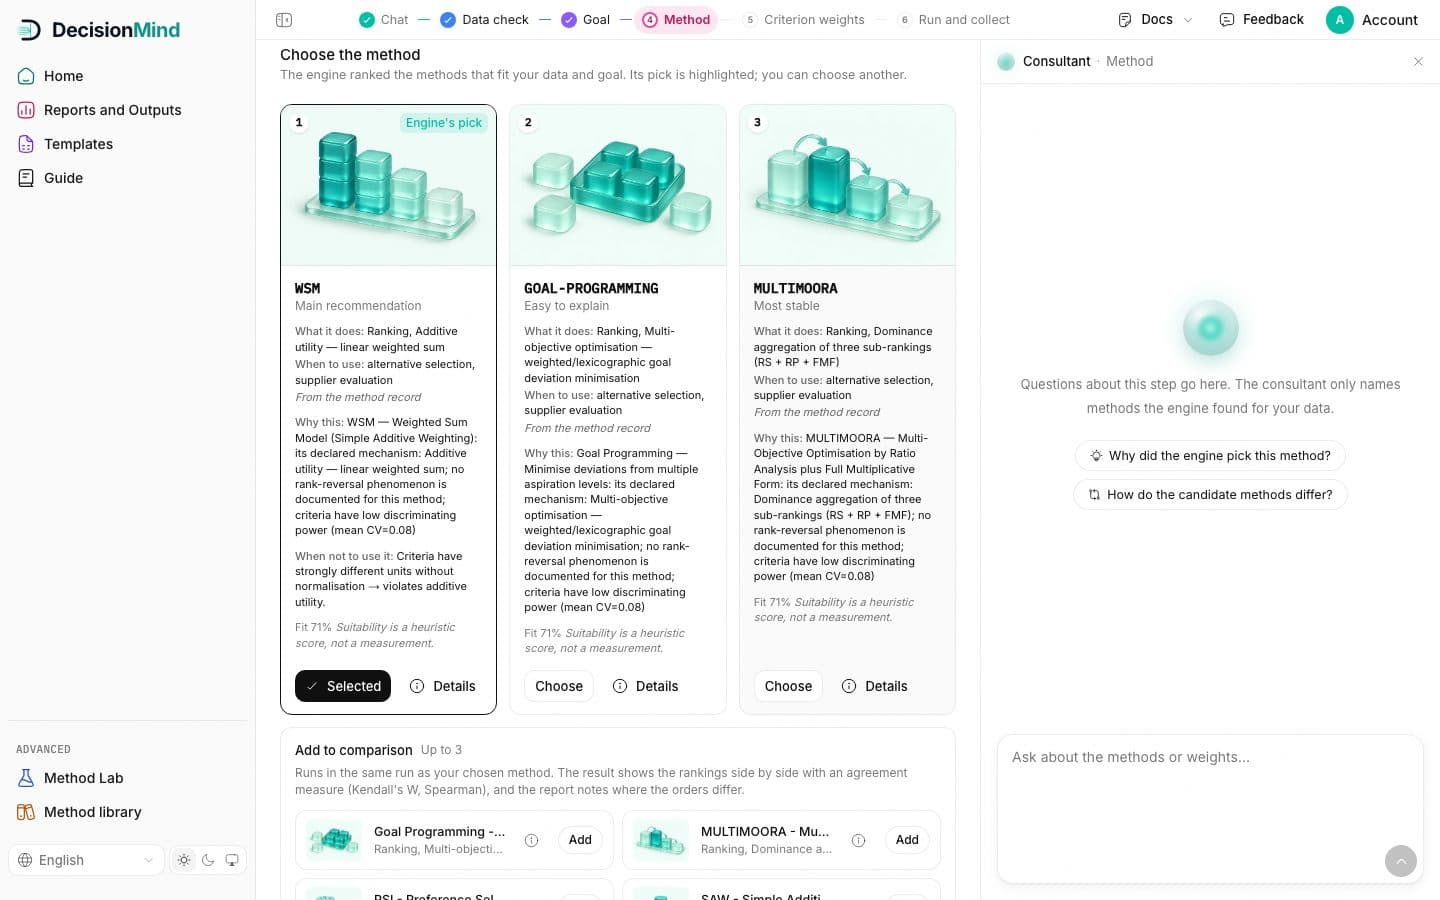
Reading a candidate card
- What it does: the method's category and what it computes.
- When to use: the decision problems its source paper was written for.
- Why this: the reasoning the system wrote for your data.
- When not to use: the situation where the source literature advises another method.
- Fitness: a heuristic score, not a measurement; the card says so.
Details and Select
Details opens the method's page from the library: authors, year, data type, the worked example and the citation. Select makes that card the primary method; Selected marks the current one.
Add to comparison
Under the cards you can add methods that run on the same data alongside the primary one. At the end of the run their rankings appear side by side with an agreement measure, and the report notes where they differ.
Criterion weights
A weight is how much a criterion counts in the result. The strip at the top repeats the criteria with their directions; the cards under it are the four ways to weigh them.
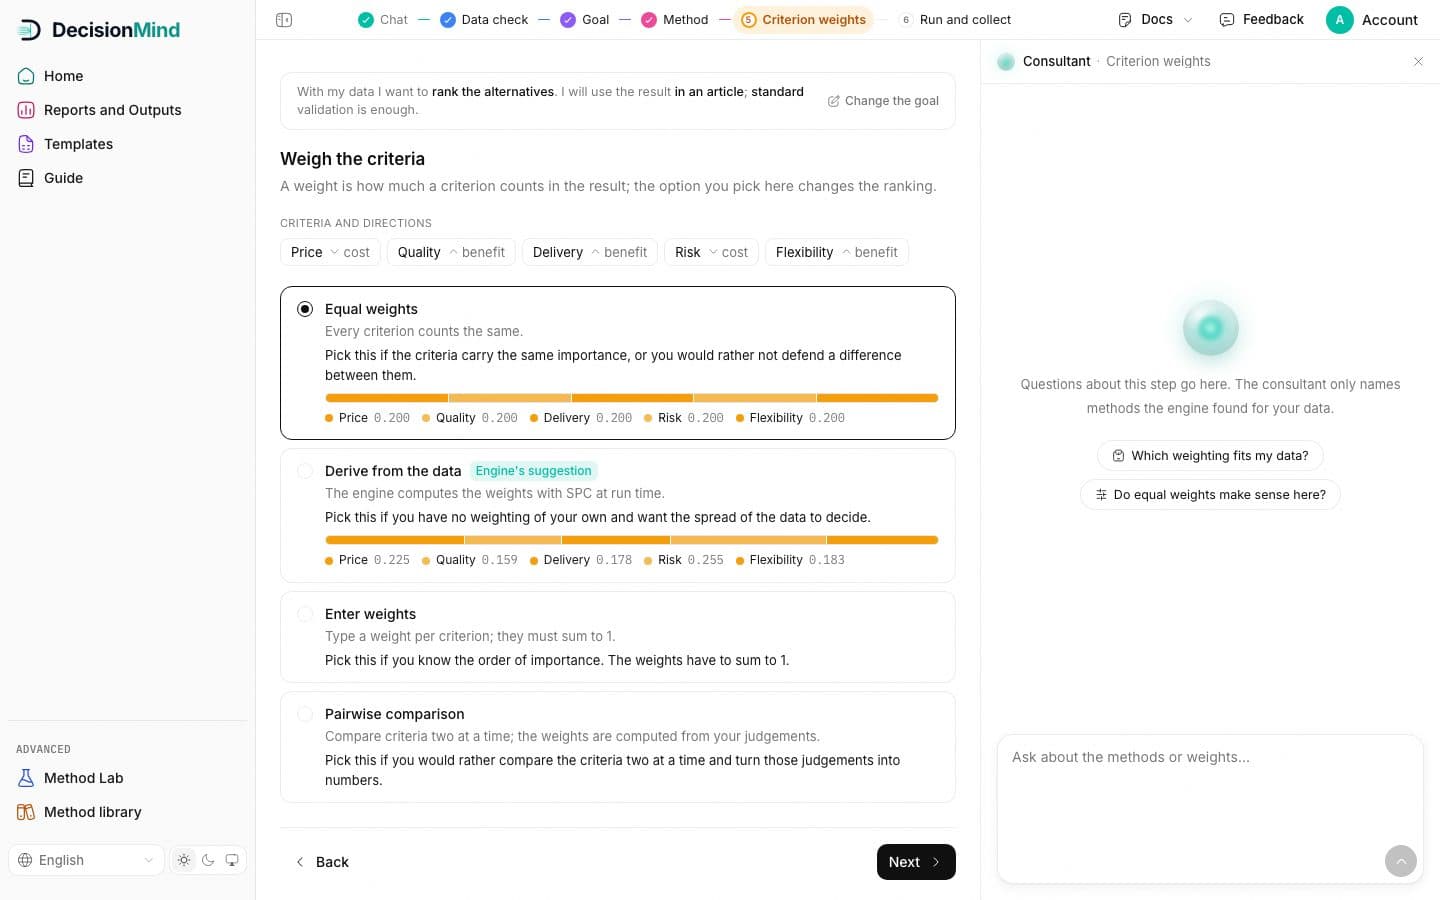
The four options
Equal weights
Every criterion counts the same. Pick this when the criteria carry the same importance, or when you would rather not defend a difference between them.
Derive from the data
The system computes the weights from the spread of the data with an objective weighting method it names on the card. Pick this when you have no weighting of your own. When the system recommends it, the card says System's suggestion.
Enter weights
Type a weight per criterion; the sum is checked and must be one. Pick this when you already know the order of importance.
Pairwise comparison
Compare the criteria two at a time; the weights are computed from your judgements and the consistency of the answers is reported.
Methods that need expert input
Some methods ask for more than weights: thresholds, preference functions, a best and a worst criterion. When the primary method is one of them, this step adds the form the method needs, with the meaning of each field.
The bar under each card
Each card draws the weights it would produce, criterion by criterion, before you commit; the numbers are the ones the run will use.
Run and collect
The last step shows the analysis as four parts on one line: Data, Goal, Method, Weights. Check them, pick the report language, press Run.
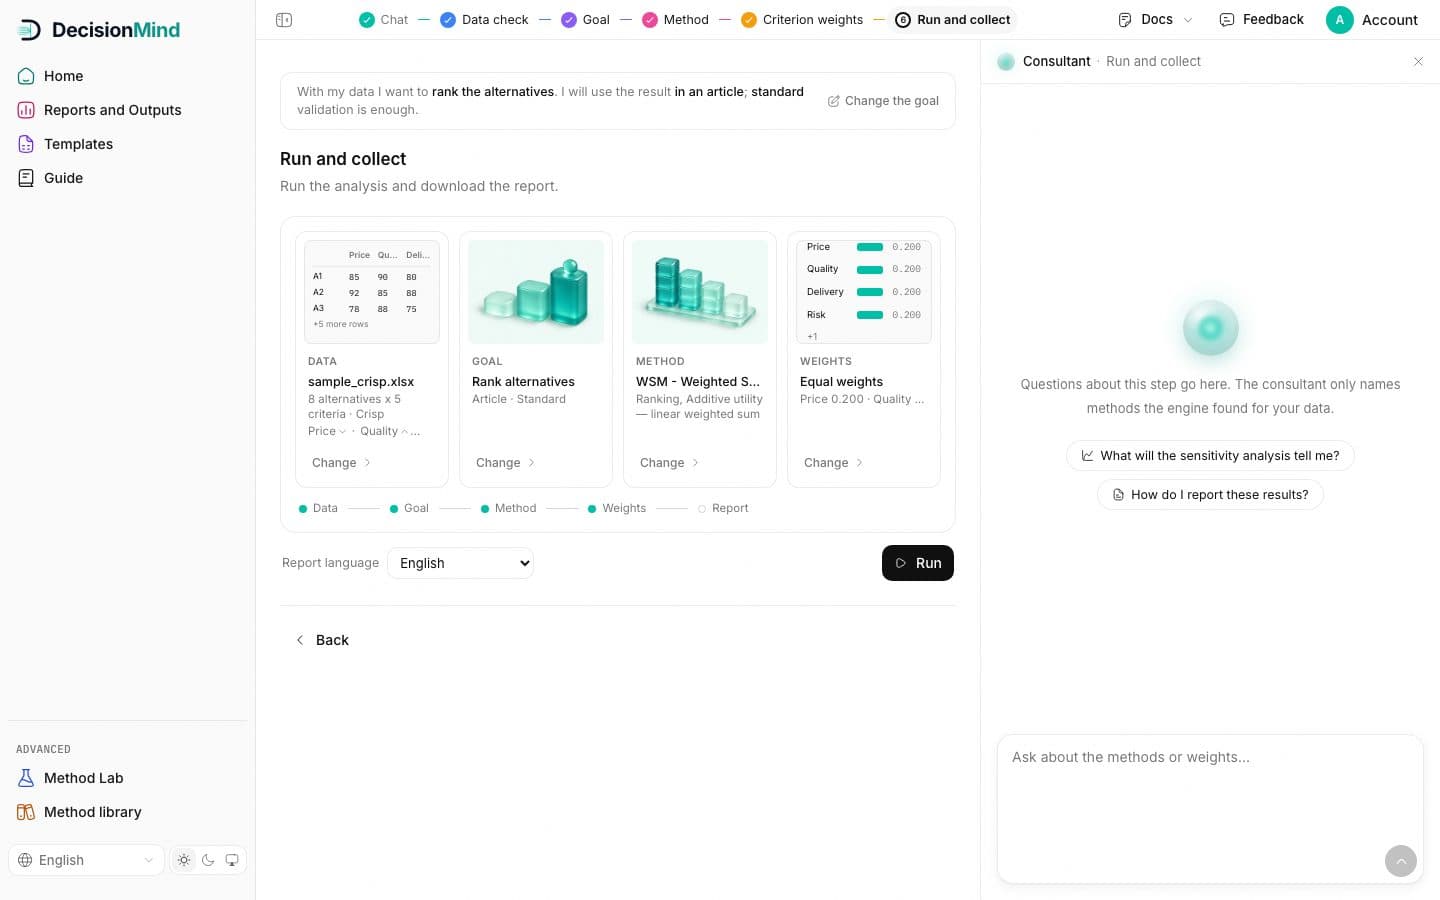
The four parts
Every part carries what it holds and a Change link that opens its step. The line under the cards shows which parts are set and that the report is still to come. Report language sets the language of the report the run generates; you can generate another language later from the results page.
While it runs
The run scene names the stages the system passes: reading the data, the value space, the method steps, the quality gates, the report. A run that takes long shows a note instead of a spinner; nothing is faked.
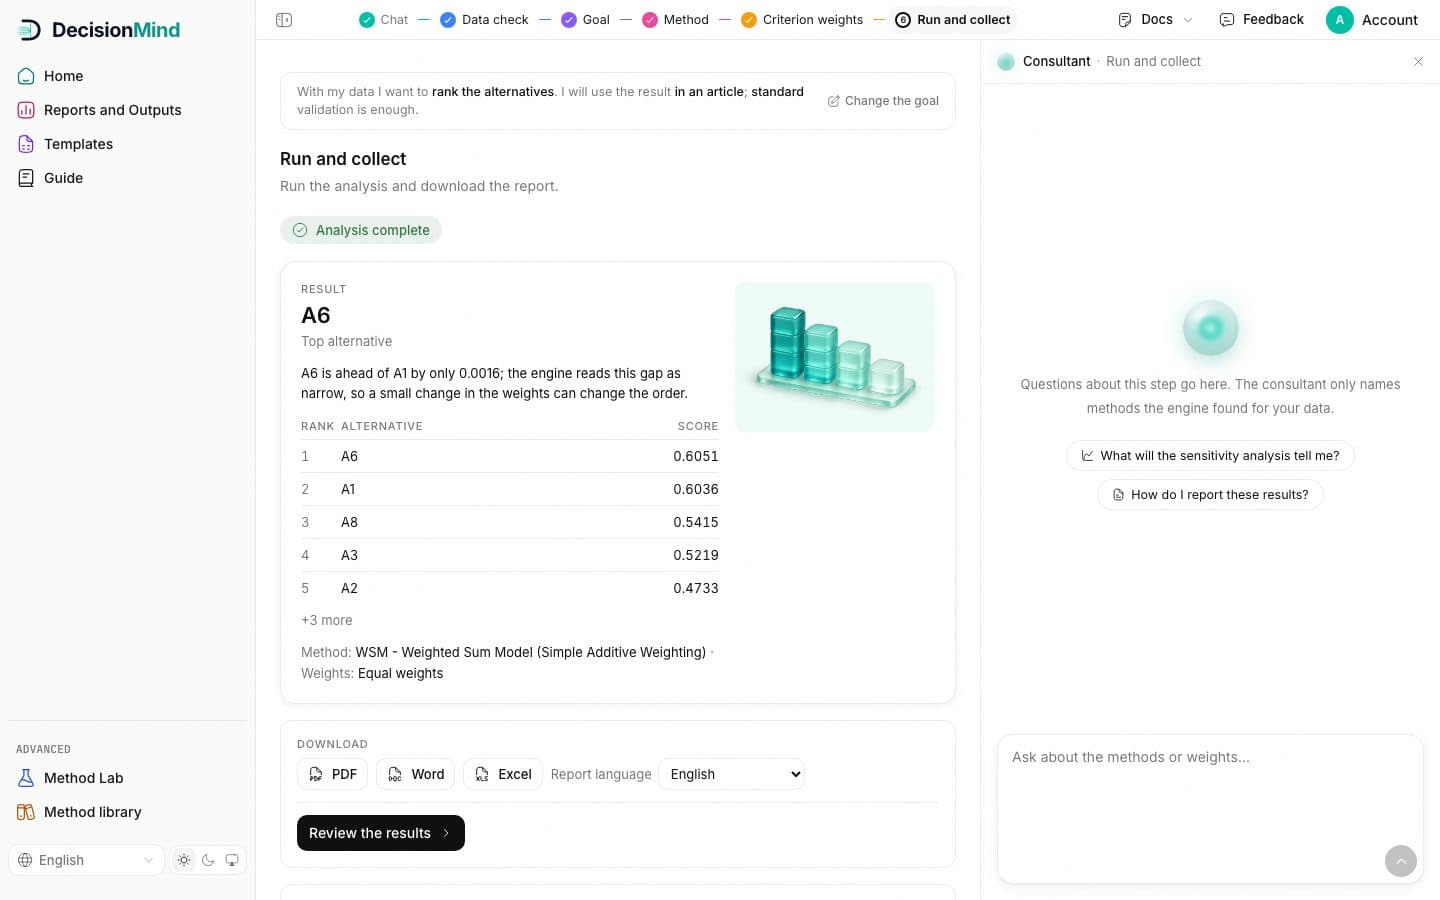
The result card
Analysis complete opens the result: the top alternative, a sentence on how far ahead it is and whether the system reads that gap as narrow, the ranking with scores, the method and the weighting used.
Do the methods agree?
When you added methods to compare, a table puts the rankings side by side and an agreement coefficient says how far they concur. Disagreement is a finding, not an error; the report discusses it.
Download and review
PDF, Word and Excel download from the card. Review the results opens the results page, where every panel of the analysis lives.
Reading the results page
Reports and Outputs opens a finished analysis on its results page: a header strip, a rail of panels on the left, the consultant on the right.
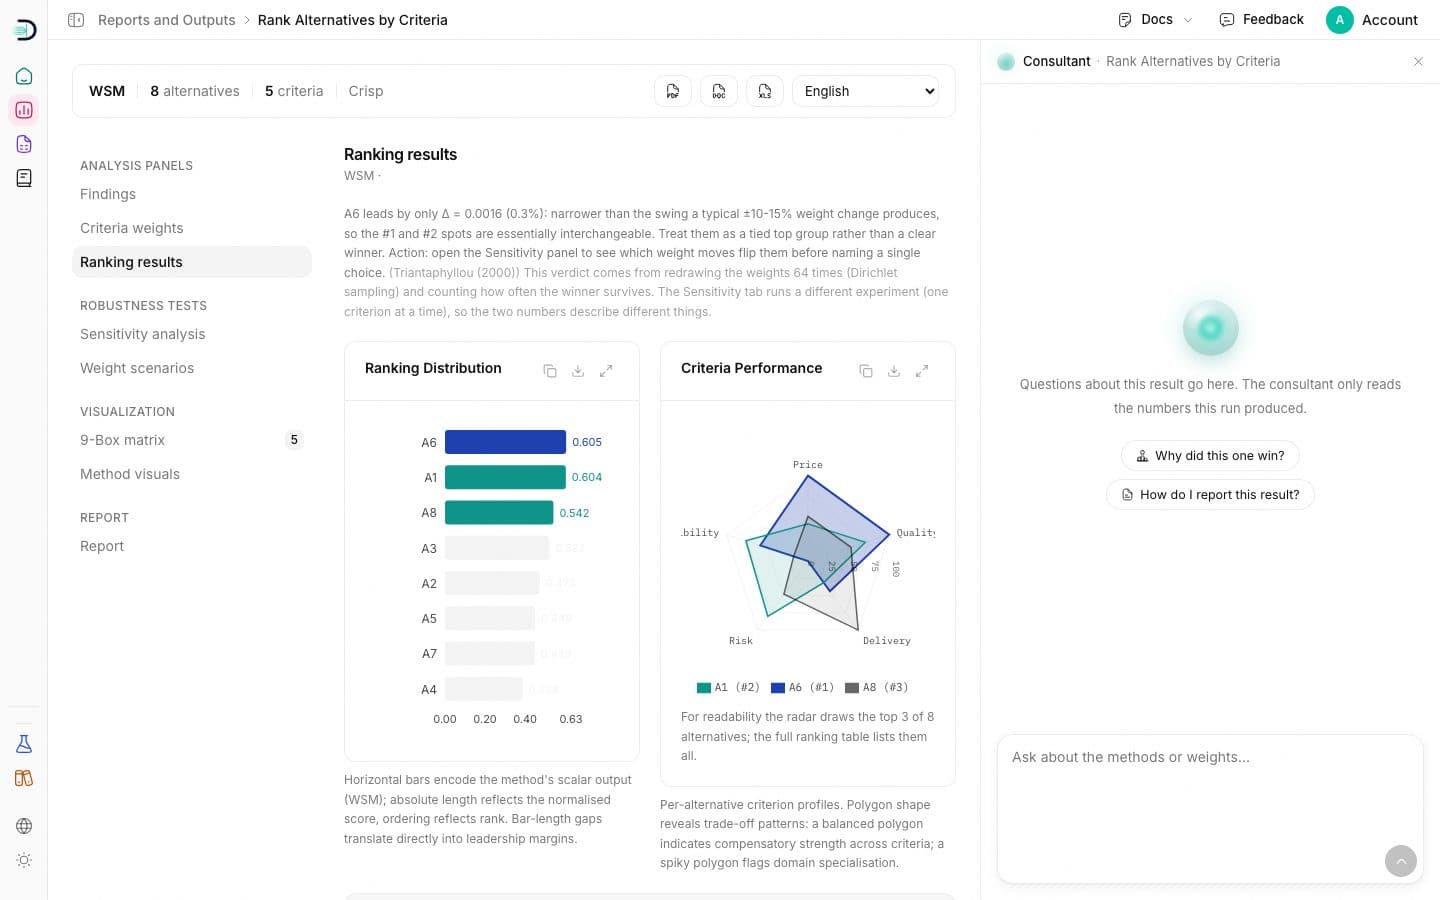
The header strip
The method, the number of alternatives and criteria and the value space, then the three download buttons and the report language. Downloads from here are the same files as in the wizard.
The panels
- Findings
- The system's reading of the result in prose: the leader, the margin, what the sensitivity run showed, what to do next. Every sentence rests on a number the system produced.
- Criteria weights
- The weights the run used, per criterion, with the method that produced them.
- Ranking results
- The scored ranking, the score chart and the criterion profiles of the leading alternatives, with a caption that says how to read each chart.
- Method comparison
- When more than one method ran: the rankings side by side and the agreement coefficient.
- Sensitivity analysis
- Each weight nudged one at a time; the panel shows which alternatives keep their place and which criterion can change the order.
- Weight scenarios
- Many random weight structures drawn at once; the panel shows how often each alternative stays on top.
- 9-Box matrix
- Performance against potential in a nine-cell grid, for goals where two views of the alternatives make sense.
- Method visuals
- Charts the chosen method declares in its manifest; a method with none says so.
- Report
- The full report of this run, its language, and the download rows.
The consultant here
The rail on the right answers questions about this run only and reads only the numbers this run produced: why an alternative won, what the sensitivity panel means, how to report the result.
What is in the report
The report has four main parts: Method, Application, Findings and References. It is generated by the system from the run, in the language you chose.
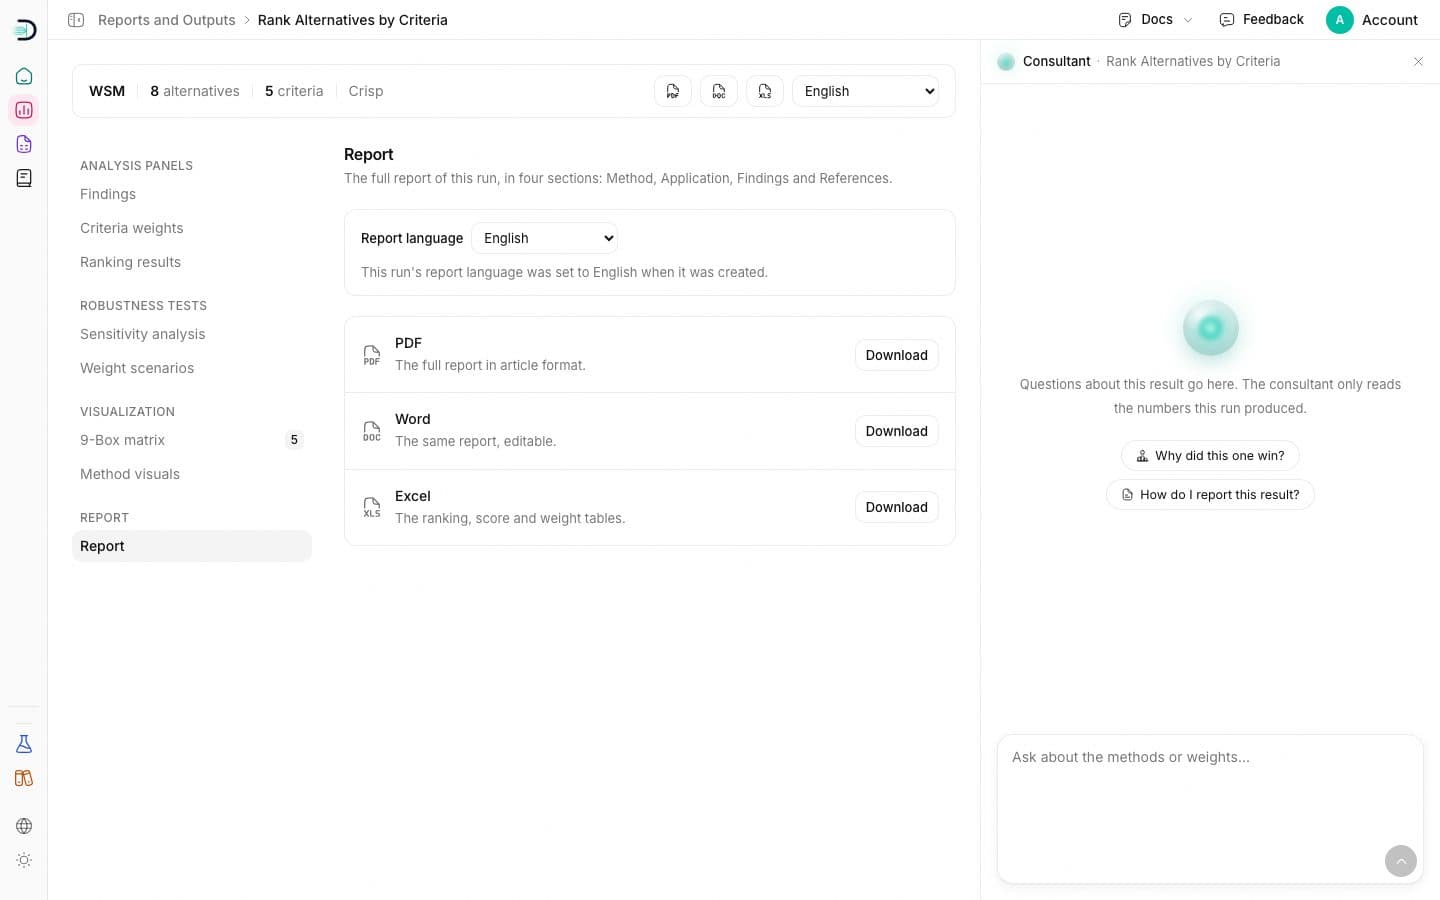
The report follows the skeleton of an MCDM application article. It opens with a trust strip; when there is a single leading alternative a short verdict follows, then the abstract and the introduction. Each main section does one job: Method gives the formulas, Application gives the numbers, Findings give the interpretation, References give the grounding. Nothing the platform cannot know is written; those places are left as marked author notes for you to fill in.
Method
The background of the chosen method, its numbered formula steps and the flow chart. The steps and formulas come from the method's own manifest, the same source the method's library page reads. Where a step produced values, its table sits right under the formula.
Application
Purpose and scope, written from the goal sentence; the criteria table with each criterion's name, direction and weight; the raw decision matrix with its directions. There is no interpretation in this section, only your data. The literature basis of the criteria and the data source are marked author notes.
Findings
The weighting frame, the primary result in the shape your goal asked for (a ranking, a class assignment or a weight vector) and the sensitivity analysis, followed by the method comparison, the discussion and the conclusion. Every number comes from the system, and interpretive sentences rest only on what the system produced. Where a sensitivity or comparison analysis matters for the result but was not run, the report says so openly instead of inventing it.
References
The method's source paper and its extensions, a copyable methodological statement and the platform's BibTeX entry for citation. The appendices follow: the reliability note, the normalisation view, intermediate calculations and fallback tables, so every derived number can be audited. The imprint closes the report with the run id, the fingerprint of the method manifest, the generation time and the reproduction statement.
Which layout you get follows the goal sentence: an article or thesis purpose, and every Word download, uses this academic skeleton; other purposes get a leaner body on screen and in PDF. You download the report from the header strip of the results page or from its Report panel, as PDF, Word or Excel, in the language you choose.
Reports and Outputs
Every analysis you started is one row here: the completed ones with their results, the drafts where you left them.
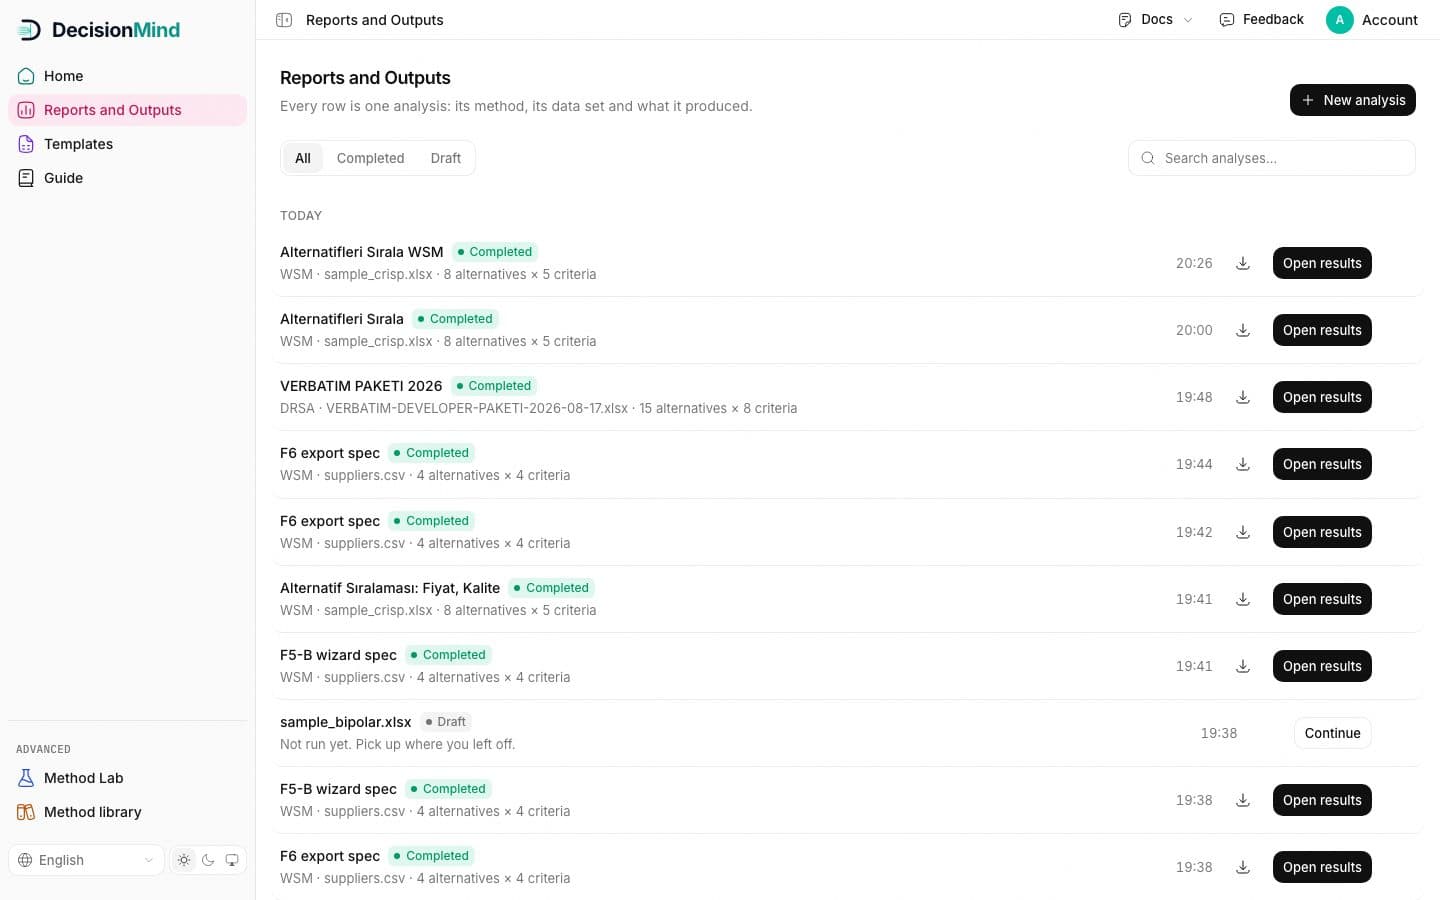
Reading a row
- The name: taken from your file or the sentence you typed.
- Completed: the method, the file, the table size; Open results goes to the results page, the download icon fetches the report.
- Draft: not run yet; Continue reopens the wizard at the step you left, the bin deletes the draft.
Filters and search
All, Completed and Draft narrow the list; the search box matches names, methods and file names. Rows are grouped by day.
History in the sidebar
The sidebar keeps your latest work one click away with its own search; All analyses opens this page. A dot next to a name shows a run still in progress.
Templates and the method library
Templates give you a correct file for every data type; the method library is where every method stands with its source, its assumptions and a way to start from it.
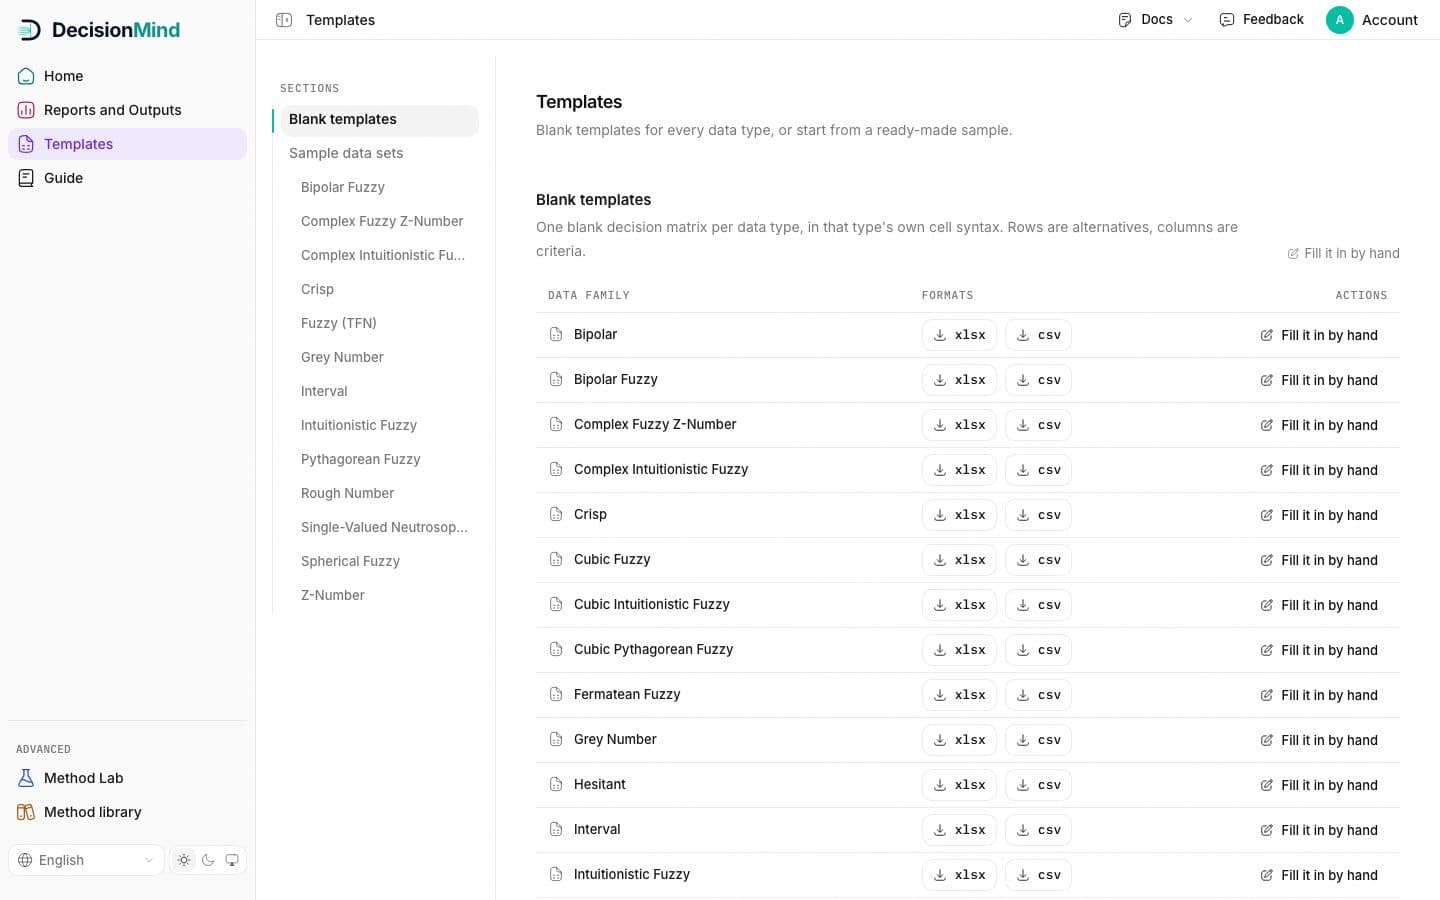
Blank templates
One blank decision matrix per data type, in that type's own cell syntax, as Excel or CSV. Fill it in by hand opens the same table on screen instead.
Sample data sets
A ready table per data type. Opening one creates a draft and lands on the data check, so you can rehearse the wizard end to end.
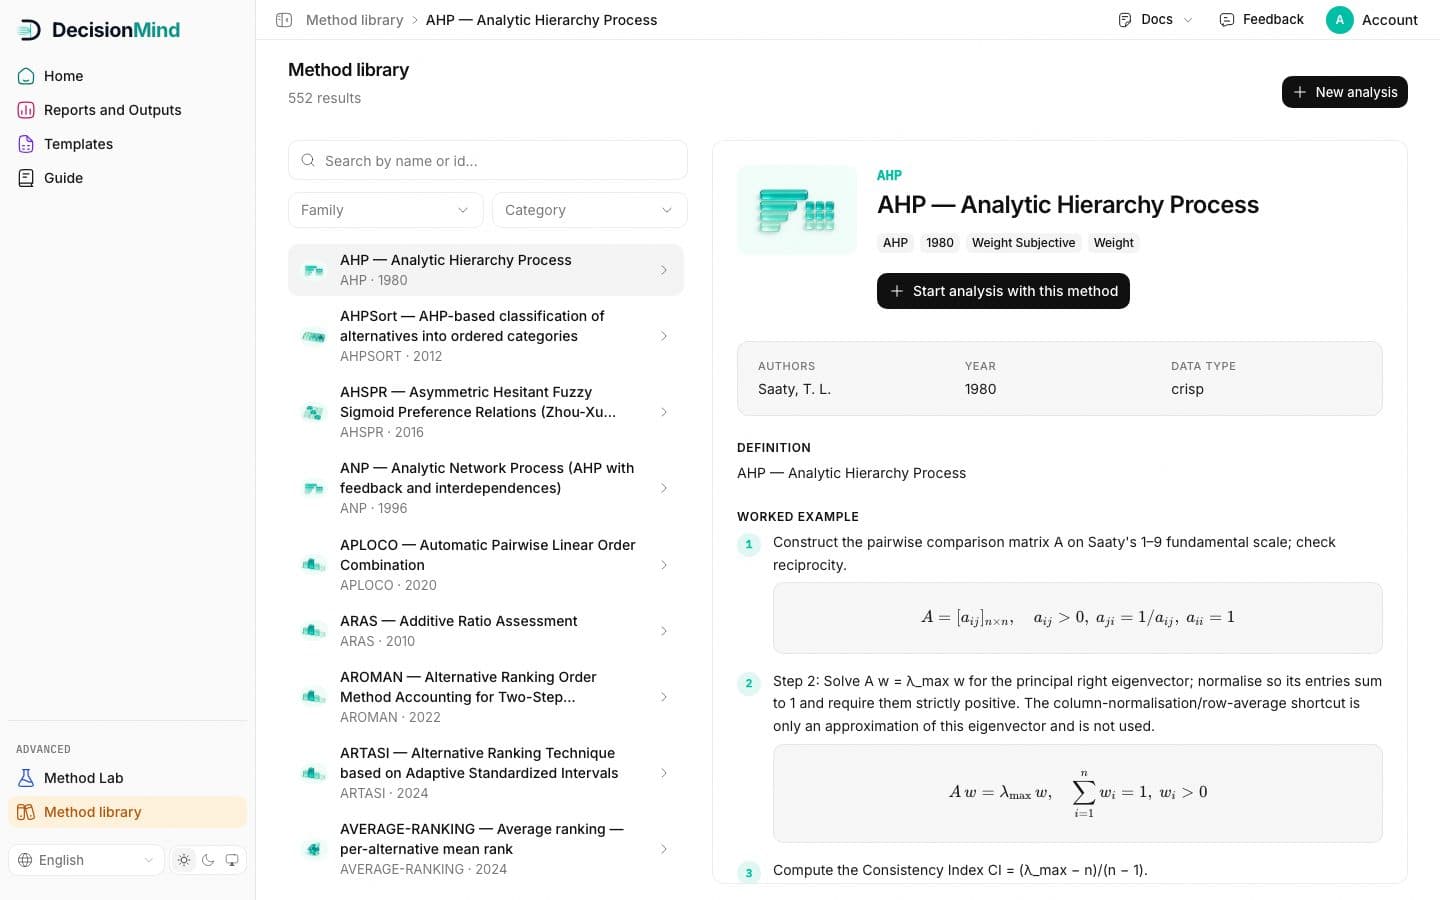
The method library
Search by name or id, narrow by family and category, pick a method: its page shows authors, year, data type, the definition, a worked example with the formulas, and the assumptions and limits. Start analysis with this method opens the wizard with that method preselected.
The public index
The same methods are listed by family on the public Methods page, one page per method, so a colleague without an account can read what you used.
Method Lab
Method Lab is the comparison workbench under Advanced: take a finished analysis and put several methods side by side on its data before you commit to one.
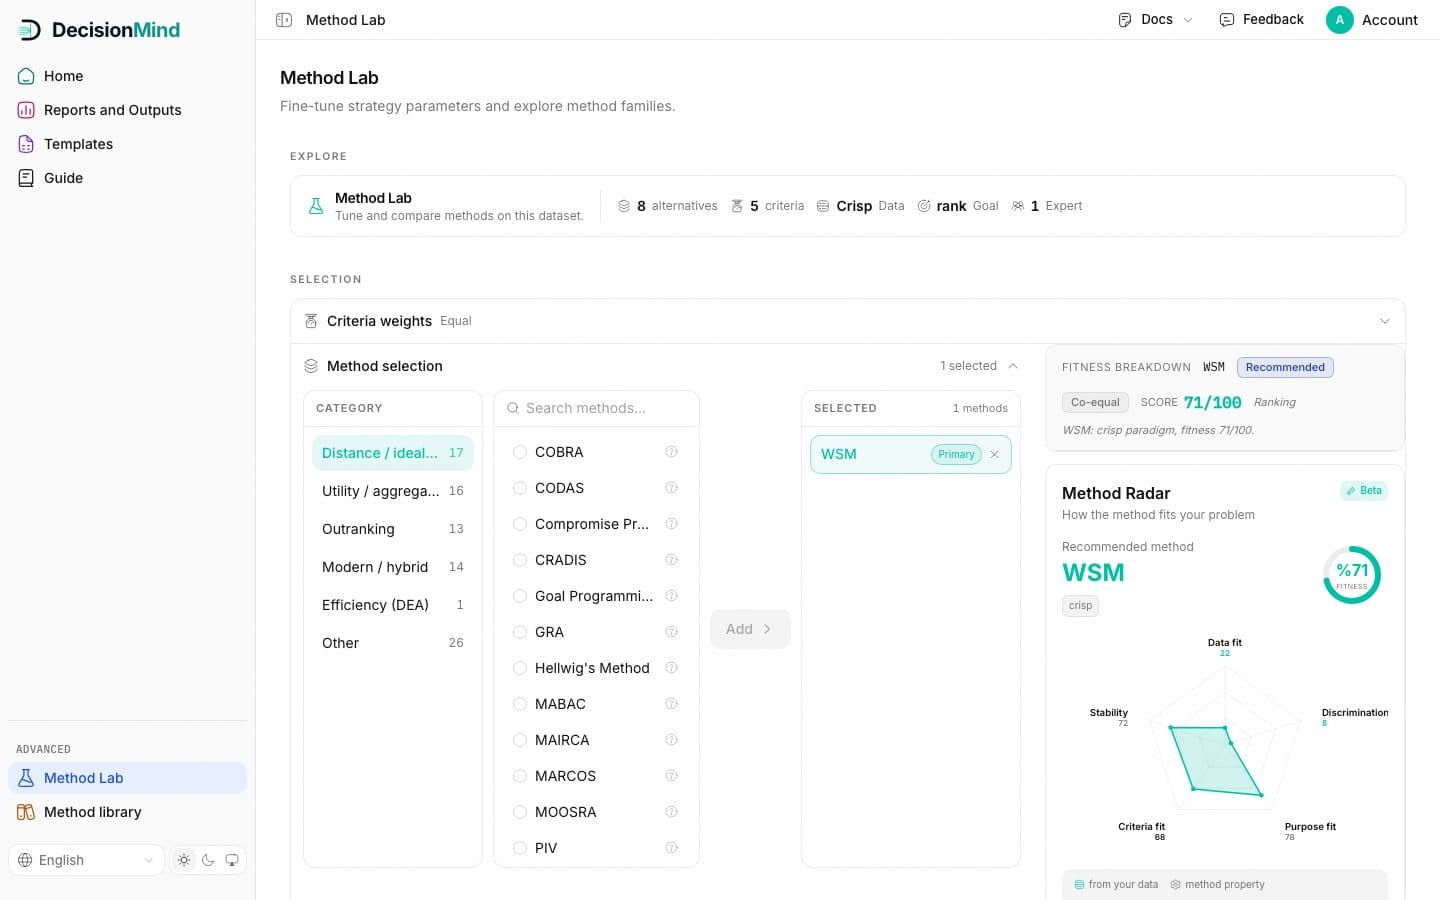
Getting in
Open Method Lab from the sidebar and pick one of your finished analyses; its data, goal and weights flow in. The lab is part of the plans that include it; the pricing page lists which.
What you do there
Choose methods from the pools, read each one's fitness and radar, tune the parameters and the validation tests, run them together or separately, and merge their rankings when you need one answer.
Plans and quota
A free start, monthly plans and a plan for teams. What each includes, and how many analyses a month it covers, is on the pricing page; this section says how the quota behaves.
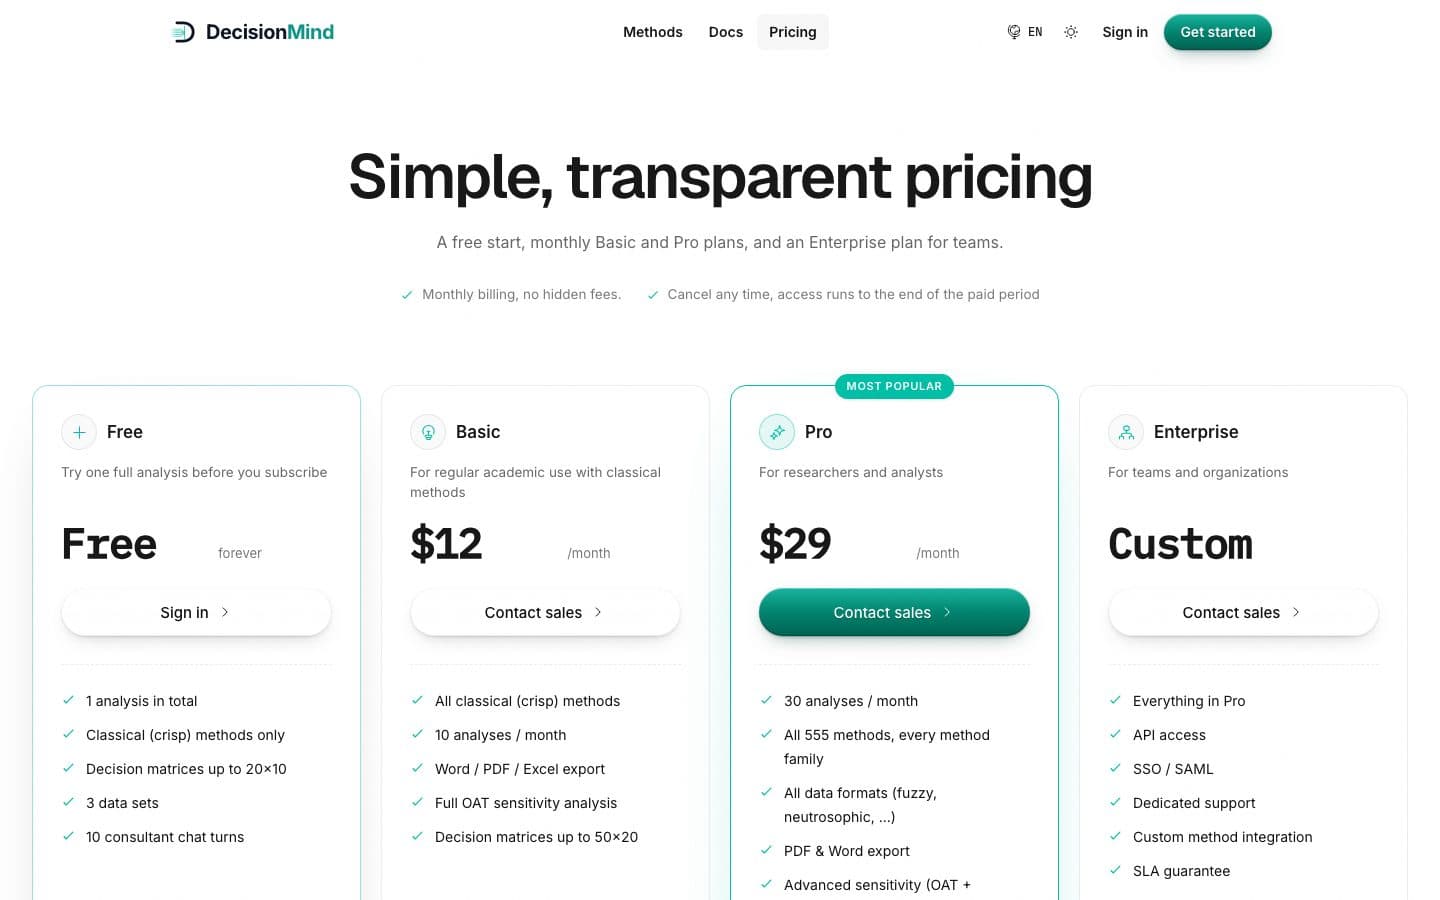
How the quota counts
Each completed run counts one analysis; drafts do not count until you press Run. The count resets monthly on the paid plans. When it runs out the wizard says so at the Run step and offers the next plan; nothing you already ran is lost.
The free start
The free plan lets you run a full analysis and read its results before you subscribe; the pricing page lists its limits on data size and method families.
Where to manage it
Account, then Billing: the active plan, the invoices and the payment method. Choose a plan opens the pricing page.
Ready to analyze your own decision?
Start an analysisThe stress test
Drag a weight and the ranking recomputes while the report assembles beside it.
Illustrative example: not live system output